

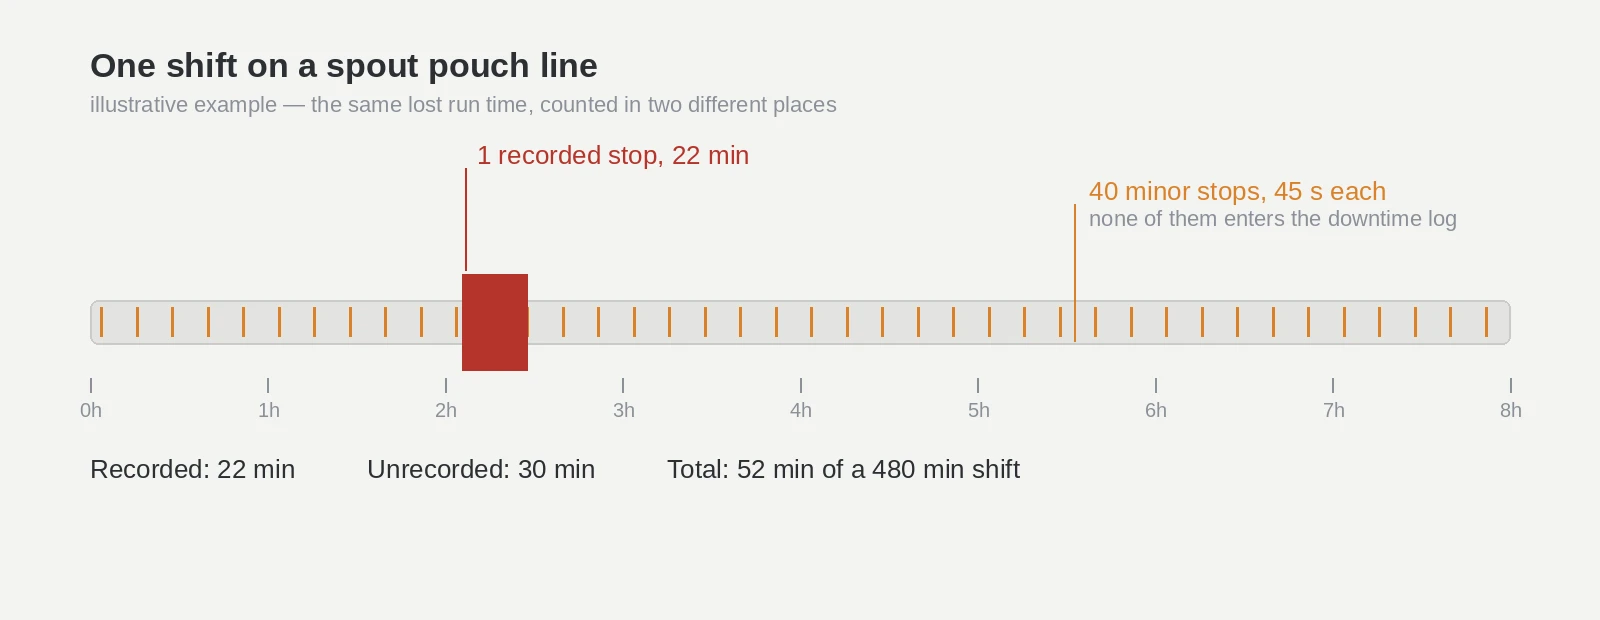
A twenty-two minute stop is one line in a shift report. The money it spent is in five places, and about half of it is not in the report at all. That gap is why a packaging line downtime cost figure pulled from the shift log comes out lower than the number finance eventually finds — and why the figure you actually need for a closure decision is not a plant hourly rate, but a cost per 1,000 pouches.
This page builds that model from the spout up. Everything in it applies to spout and cap fitments on stand-up pouches and doypacks — not to gas-can spout caps, which share a name and nothing else — and every currency figure below is an illustrative assumption, labelled as one, so you can replace it with your own line's numbers in about ten minutes.
Why the packaging line downtime cost you need is a component cost
The published benchmarks are honest about what they measure, and it is not your problem. Siemens puts the world's 500 biggest companies at almost $1.4 trillion a year in unplanned downtime, about 11% of revenues, and an average large plant at $253 million a year. The same survey puts a lost hour at $36,000 at the low end, in fast-moving consumer goods, and $2.3 million at the high end, in automotive. It also gives the two numbers that are actually useful to a packaging engineer: an average plant now records 25 unplanned downtime incidents a month and loses 27 hours a month to them.
Twenty-five events and 27 hours. If your line looked like that average, you would be averaging barely an hour per event — and you would already know that the average event is not one dramatic failure. It is a series of small ones.
None of those figures can answer the question a buyer of closures has to answer: is this spout worth what it costs? A packaging line downtime cost that comes from a plant-level average is an average across every asset in the building, weighted toward the expensive ones. Your filler is not that. The only figure that can carry a purchase decision is one scoped to the component that causes the stop, expressed in a unit that sits next to an invoice line — which is why everything here ends in cost per 1,000 pouches.
One scoping note, because it decides what belongs in the model. This is about the closure as one of several causes of line time loss on a spout pouch filling line, not about every cause. Machine alignment, film lot variation, operator technique and product foaming all take line time. The model below is deliberately narrow: it counts what changes when you change the spout or the cap, so that the answer can be attributed to a supplier conversation rather than to the building. If the closure specification itself is still open, the guides under choosing and running spout caps fix the bore, the resin and the sealing window first; this article assumes those are settled.
Five buckets a spout-attributable stop fills
Every spout-attributable stop, whether it lasts twenty seconds or two hours, fills the same five buckets. Miss one and the model understates the cost by exactly that bucket; double-count one and the number stops being defensible in a meeting. A packaging line downtime cost built only from the buckets you can find in the system is a floor, not a total — and the two buckets that are usually missing, restart scrap and recovery, are the ones that hide most of the pouch filling line stoppage causes worth fixing.
Bucket | What goes in | Where the number lives |
|---|---|---|
Lost output | Pouches the line would have made, at the margin those pouches earn | Line rate and standard contribution from finance |
Idle labour | Everyone standing still plus everyone fixing it, at loaded cost | Payroll and shift roster |
Restart and scrap | Filled pouches destroyed in the jam, plus the first-off run after restart | Scrap log and material standard cost |
Recovery | Overtime, extra shift, expedited freight used to make the volume up | Production plan versus actual |
Commercial | Late-delivery penalties, expedite charges from your customer, order loss | Contracts and customer scorecards |
The framework most cost-of-downtime guides use has a sixth line for repairs and spare parts, and it is folded into the two rows above rather than dropped: repair labour is part of "everyone fixing it", and the part that fails on a closure-caused stop is a moulded closure whose cost is negligible against the minutes it costs. If the stop does force you to buy a change part or replace a damaged tool, put that invoice on the restart line — it belongs in the model, just not in a bucket of its own.
Two of these are routinely left out, and omitting them understates the cost rather than protecting it.
Restart and scrap is not just the pouch in the sealing jaw. When a spout jams at the in-feed, the pouches already filled downstream keep coming; you either dump them or finish them by hand. Then the line restarts below rate for several minutes, and the first-off packs are checked and often rejected as a precaution. A stop that reads as 22 minutes on the clock is usually 25 to 30 minutes of lost output.
Recovery is the bucket that separates a 22-minute stop from a 22-minute stop you can absorb. If the line has spare capacity later in the week, you may not lose the sale — you lose the overtime, the expedited freight, or the planned maintenance window you gave up. If it has no spare capacity, the loss moves into the commercial bucket and stops being a production problem at all.
The fifth bucket stays unpriced on purpose. Late-delivery penalties and lost preferred-supplier status are real, occasionally larger than the other four combined, and impossible to attribute to a single closure event without a contract in front of you. Put a line in the model that says "not priced" rather than a guess.
The half of the loss that never reaches your downtime log
Here is the part that changes the arithmetic, and it is where most cost-of-downtime writing stops.
Overall equipment effectiveness is availability × performance × quality, and OEE on a packaging line is where this distinction does the most damage. The Lean Enterprise Institute's definition is explicit about where short stops land: the performance rate covers operating speed losses and "stoppages lasting a few seconds", while the availability rate carries failures and adjustments. A stop that an operator clears in forty seconds is a performance loss. It never becomes an availability event, and an availability-based downtime log — which is what most shift reports are — cannot see it.
The Six Big Losses framework names the category: Idling and Minor Stops, defined as time when "the equipment stops for a short period of time (typically a minute or two) with the stop resolved by the operator", with misfeeds, material jams and obstructed product flow as the standard examples (OEE.com's Six Big Losses reference). The same reference sets the tracking threshold by policy — for instance, "any downtime longer than two minutes should have a reason associated with it" — and then states the consequence plainly: "Most companies do not accurately track Idling and Minor Stops."
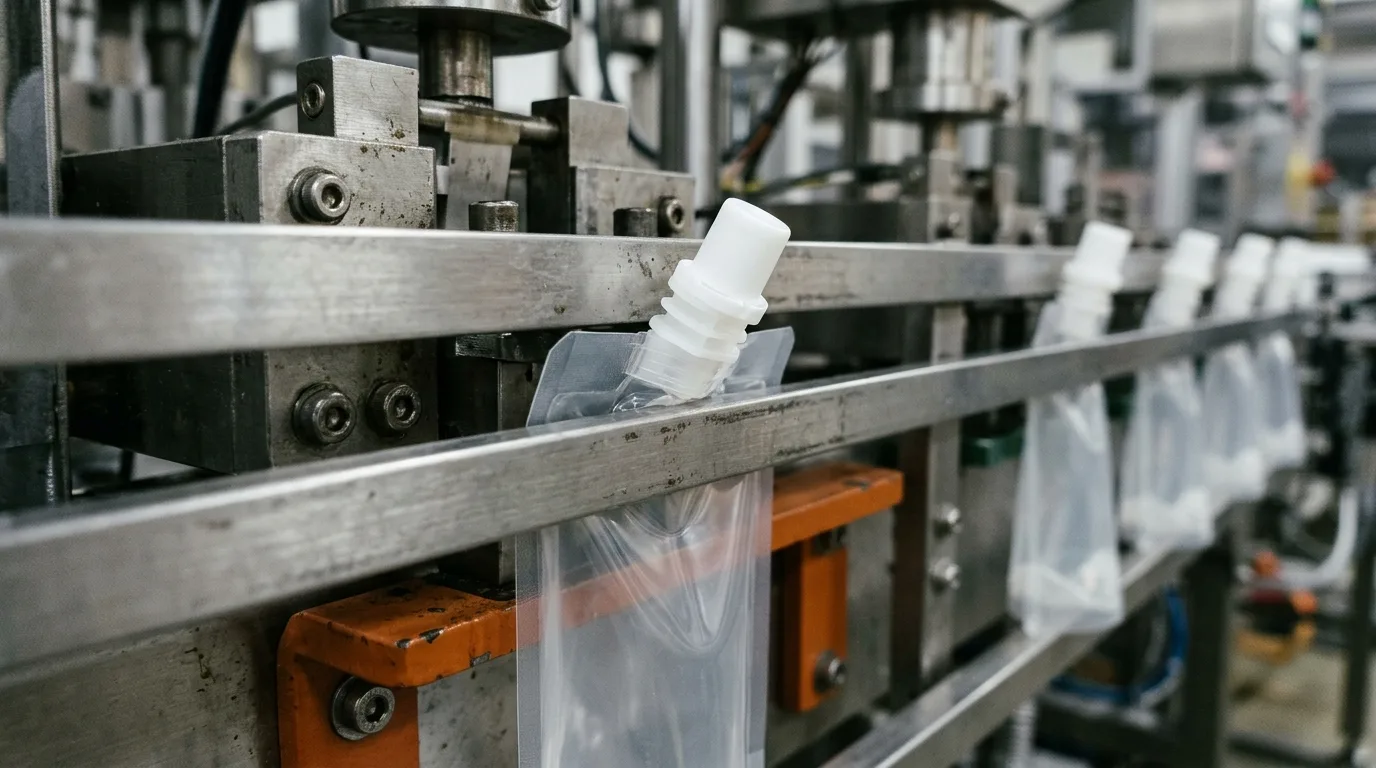
Most of what a spout does wrong at speed lands in that blind spot. A fitment that sits a millimetre high in the carrier. A cap that arrives upside down in the chute and is flipped by hand. A flange that catches the rail on the way into the sealing station — the classic spout jam on a filling line. Each one costs the line less than a minute and one or two pouches. None of them generates a reason code. All of them are attributable to the component. A changeover resets the count, which is why the first hour after one is worth tallying separately.
The arithmetic of accumulation is what makes them worth modelling. At 6,000 pouches an hour, five minor stops an hour at 45 seconds each is 225 seconds — 6.25% of run time, or 125 hours across a 2,000-hour year. That is more line time than 250 recorded stops of 22 minutes would cost you, and it will not appear anywhere in a monthly downtime report.
Measure minor stops as events per 1,000 pouches, not as minutes per shift. Minutes get rounded to zero in a shift handover; a rate per thousand pouches is a specification you can hold a supplier to.
The arithmetic, with every assumption on the table
Two formulas do all the work, and they are what turns a packaging line downtime cost estimate into a decision. The first prices one event; the second converts a year of events into a unit you can put beside a cap price. You do not need a packaging line downtime cost calculator for this — a spreadsheet, five inputs and twenty minutes is the whole tool.
Cost per event = (rate × unrecovered hours × margin per pouch) + (loaded labour rate × hours stopped) + scrap per restart + recovery cost + commercial cost >Cost per 1,000 pouches = (total cost in period ÷ pouches produced in period) × 1,000
The worked example below uses one line, one shift pattern and five stated assumptions. Substitute your own and the structure holds; the numbers will not, and should not.
Input | Illustrative assumption |
|---|---|
Line rate | 6,000 pouches/hour |
Run hours | 2,000/year (8-hour shift, 250 days) → 12 million pouches |
Contribution margin | $0.08 per pouch |
Recorded spout-attributable stops | 250/year, 22 minutes average → 91.7 hours |
Idle labour | $120/hour (four people at $30) |
Restart scrap | 150 pouches at $0.30 = $45 per restart |
Recovery | 30% of lost output made up on overtime at $180/hour → 27.5 hours, $4,950 (margin is charged on the other 70% only) |
Run it with that rule applied and the four priceable buckets come out like this:
- Lost output — $30,800. 250 events × 22 minutes is 91.7 hours, or 550,000 pouches at 6,000 an hour. Overtime buys back 30% of that volume (165,000 pouches, 27.5 hours), so margin is charged on the other 385,000: 385,000 × $0.08.
- Idle labour — $11,000. Four people stand still for all 91.7 hours, recovered or not: 91.7 × $120.
- Restart scrap — $11,250. 250 restarts × 150 pouches × $0.30.
- Recovery — $4,950. 27.5 overtime hours × $180, charged once at the overtime rate, on hours whose margin is not charged again.
That is $58,000 a year, or $232 per event, or $4.83 per 1,000 pouches. Charging margin on all 91.7 hours and the overtime on top is the double-count the FAQ warns about.
Now add the part that is not in the log. Five minor stops an hour at 45 seconds each, one pouch scrapped per stop, same margin and same material cost: 125 hours of lost run time and 10,000 scrapped pouches. That is a further $63,000 a year — slightly more than the recorded half — which takes the spout-attributable total to $121,000, and the unit cost to $10.08 per 1,000 pouches.
Two checks before you trust a number like that. First, the benchmark figures cannot validate it: $36,000 an hour in fast-moving consumer goods is a plant-level, revenue-and-overhead figure, and it describes a whole building's lost hour, not the margin your line would have earned. Comparing the two produces the kind of claim that gets a cost model thrown out in its first meeting. Second, the margin assumption scales the answer linearly — halve it and the lost-output buckets halve — so run the model at your figure ±30% and check whether the decision changes. For a closure choice, it usually will not. And every magnitude above is shaped by European and North American cost levels; replace the labour rate and the material cost with your own market's before you put the figure in front of anyone.
The useful next step is to stop treating these inputs as things you remember and start treating them as specification fields. A closure specification that records line rate, event rate and the scrap standard turns next year's version of this calculation into a lookup rather than an investigation; the closure specification sheet is the place to write them down.
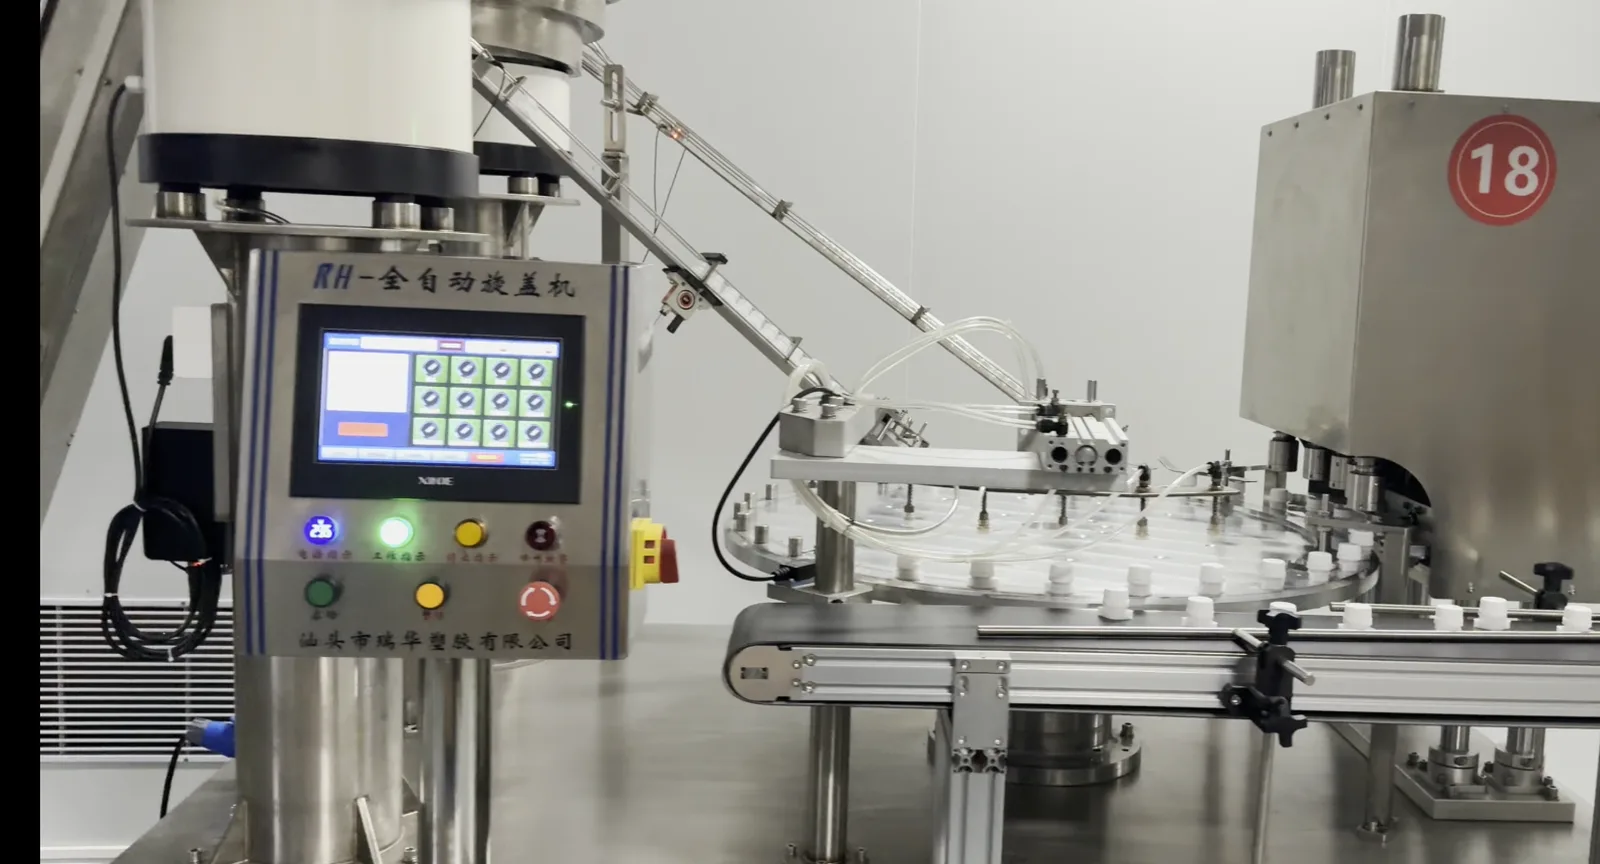
What one closure batch can do to a month of line time
A cost model is only worth building if a supplier can move the number. Four failure paths do, and they produce different cost shapes — which matters, because the response to each one is a different request.
Dimensional variation in the flange and bore. Two batches that meet the drawing but sit at opposite ends of the tolerance band behave differently in the carrier and the guiding rail. The result is a line that runs clean on Monday's delivery and, by Thursday, spends half a minute longer clearing the same jam it cleared in twenty seconds — five times an hour. It shows up as minor stops, not as downtime, which is why it survives for months — and it is the most common of the spout pouch filling line downtime patterns that nobody can name a cause for. Conformance to a drawing does not settle it, either: ask for the capability index on the flange diameter, because a supplier can pass every sample and still deliver a batch that sits at one edge of the band.
Resin and moisture variation. A spout that cracks at the shoulder, or a thread that strips at the torque station, is a different failure: rare, expensive, and traceable to a batch. The cost shape is one big event plus a leak investigation, not a stream of small ones.
Weld-zone contamination. Dust, flash or a release agent on the flange ring weakens the weld the pouch seal depends on. Nothing jams. The line runs faster and the cost appears weeks later as leaks that only show up after filling — the most expensive shape of all, because it is discovered at the customer.
Cap and liner seating. A cap that does not seat to the same torque window, or a liner that creeps, produces pouches that pass a fill-line check and fail in transit. The cost lands in returns and re-testing rather than in line time.
A single model cannot price all four equally well, and pretending otherwise is how these calculations lose credibility. What the model can do is tell you which shape is dominating your current loss, and therefore which supplier conversation is worth having: a dimensional report, a resin declaration, a weld-zone cleanliness control, or a liner specification. And none of it is a predictive-maintenance problem — condition monitoring watches a machine degrading over time, not a delivered batch varying between deliveries — which is why the answer sits in a supplier's records rather than in a sensor.
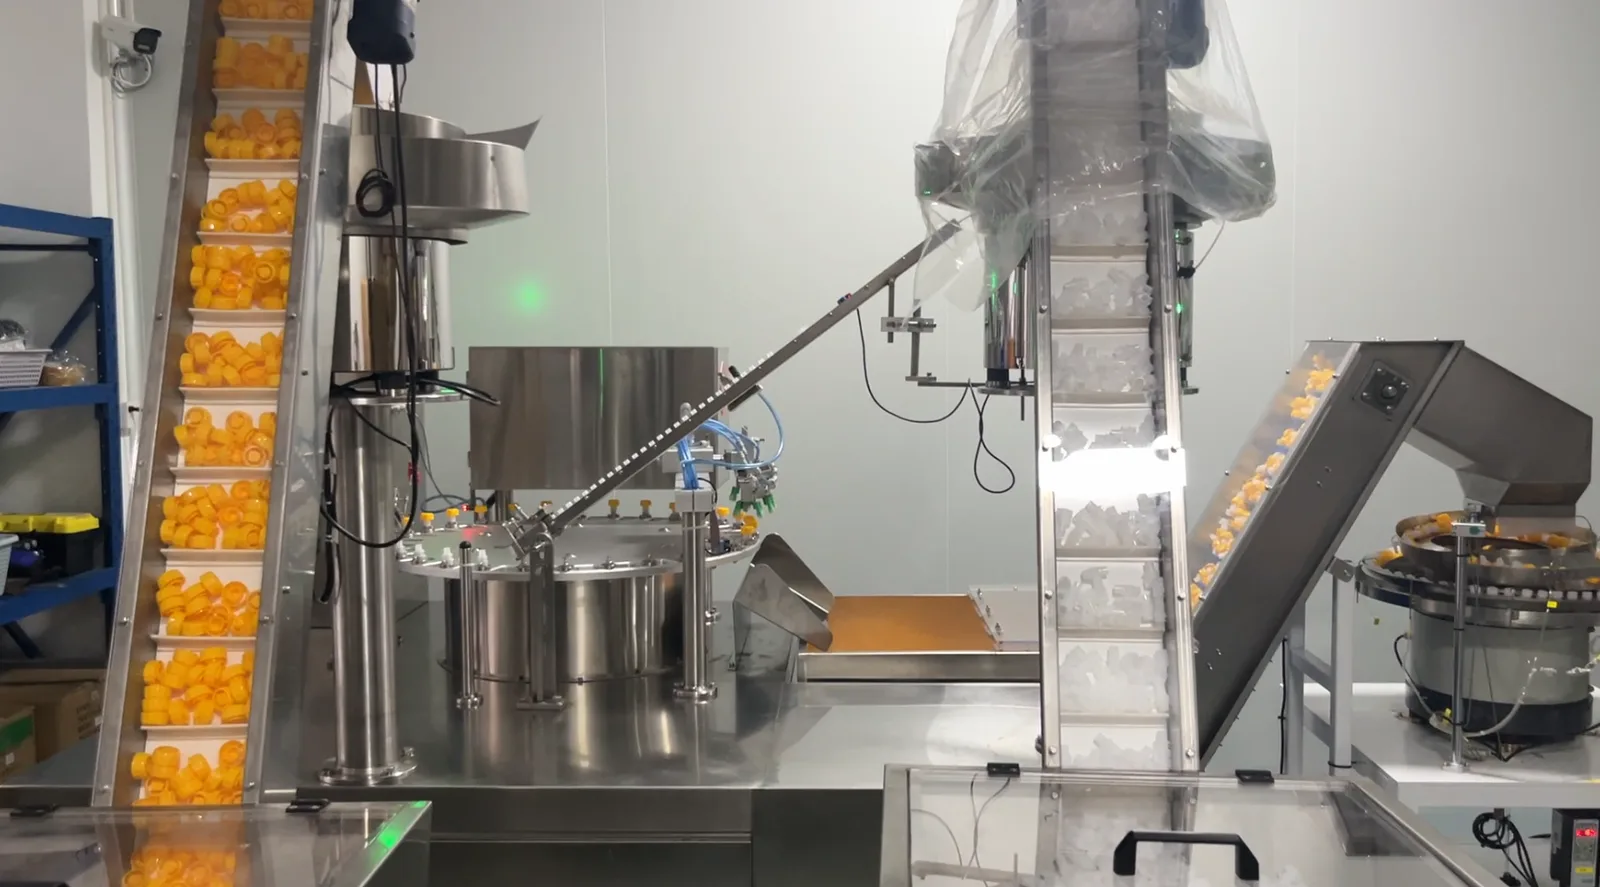
The five inputs you probably do not have, and what to use instead
Most people who start this calculation stall on the same five numbers. None of them requires new measurement, only a different place to look.
Input | Where it actually lives | Usable proxy |
|---|---|---|
Line rate | Machine set-point, or pouches per shift ÷ run hours | Rated speed × current OEE |
Margin per pouch | Standard contribution used for capital approvals | Standard cost sheet less material and conversion |
Loaded labour rate | Payroll, including on-costs | Shift cost ÷ operator hours |
Scrap standard per pouch | Material standard cost | Film + fitment + product, per pouch |
Event rate and duration | Reason-coded stoppages, plus a manual count of minor stops | Two weeks of operator tally on one shift |
Two practical notes. First, the event rate is the input people get wrong, because they count the events in the log and stop there; the minor-stop count needs a person with a clipboard for two weeks, and that fortnight is the entire cost of the model. Second, if you want a same-day estimate rather than a two-week one, a rough count beats no count: four stops an hour at a minute each is close enough to tell you whether the closure conversation is worth $5,000 a year or $50,000.
Where the two failure shapes meet is verification. A non-destructive leak test method run on first-off packs catches the weld-zone and cap-seating failures before they become a customer problem, and it is the only cheap way to confirm that a closure change actually fixed something rather than moving the loss downstream. If the closure also has to suit a sealing machine you already own, sealing machine compatibility belongs in the same conversation — a spout that costs less and seals outside your machine's window has moved the cost, not removed it.
Turning the number into a purchase argument
The output of the model is one number: cost per 1,000 pouches, attributable to the closure. It exists so that it can be compared with the only other number a closure decision usually has — price per 1,000 caps.
The comparison is a break-even, not a score. If a different closure removed half of the minor-stop loss in the example above, it would return $31,500 a year, which — at one cap per pouch, on 12 million pouches — is $2.63 per 1,000 caps. That is the premium the change can justify, everything else equal. If the premium quoted is $1.20, the decision is easy on this arithmetic alone; if it is $6, the model says the extra money is buying something the downtime calculation does not capture, and you should ask what.
Two cautions before that break-even goes into a business case. Removing half of a minor-stop loss is an assumption about a supplier's consistency, not a promise anyone can make before you have batch data — so present it as the assumption it is. And a cheaper closure that arrives with wider batch variation does not save the difference; it moves it into the two buckets that are hardest to see.
Which is what to ask for. Five documents, and any closure supplier can be asked for all five: batch dimensional records against the drawing, a resin grade declaration rather than a family name, the weld-zone cleanliness control used before packing, the liner specification, and notice of any change to tool, resin or supplier. What separates suppliers is not willingness but whether the answer exists in a record. A moulder that cuts its own tooling and inspects its own output keeps those records in the building; one that buys closures in has to ask upstream, so the answer arrives second-hand. Ruihua does both, which is why this is the list we publish.
Samples for a first-off run sit alongside the documents; the quote and sample request is where that starts, and the spout cap range shows the bores and cap styles those records would cover.
Questions that come up while building the model
Can I just use an industry cost per hour? For awareness, yes; for a decision, no. Published figures run from $36,000 an hour in fast-moving consumer goods to $2.3 million in automotive, and both are plant-level numbers built from revenue and overheads. Using one as your packaging line downtime cost per hour overstates a low-margin line and understates a constrained one — and both errors are visible to whoever checks your arithmetic.
How do I calculate downtime in production when the stop is under a minute? You do not measure it as downtime; you measure it as a rate. The way most plants calculate downtime in production — read the reason codes off the shift report — cannot see a forty-second stop, so the rate has to be counted separately. Count events over a fixed output — stops per 1,000 pouches — and multiply by an assumed duration. That converts an invisible loss into a number that responds to a supplier change, which is the only property that matters here.
Should lost sales be in the model? Only when the volume cannot be recovered. If the line has capacity later in the week, you lose recovery cost, not margin; counting both is the most common way these models double-count.
Where does the cap price enter? At the end, once, as a break-even. A price per 1,000 caps and a cost per 1,000 pouches are the only two figures a closure decision needs; every other number in the model exists to produce the second one.
Start with three stoppages from last month. Fill in the five inputs, run the two formulas, and you will have your own cost per 1,000 pouches before the end of the week — a number that survives a finance review, points at one component, and gives the next supplier conversation something to be about.